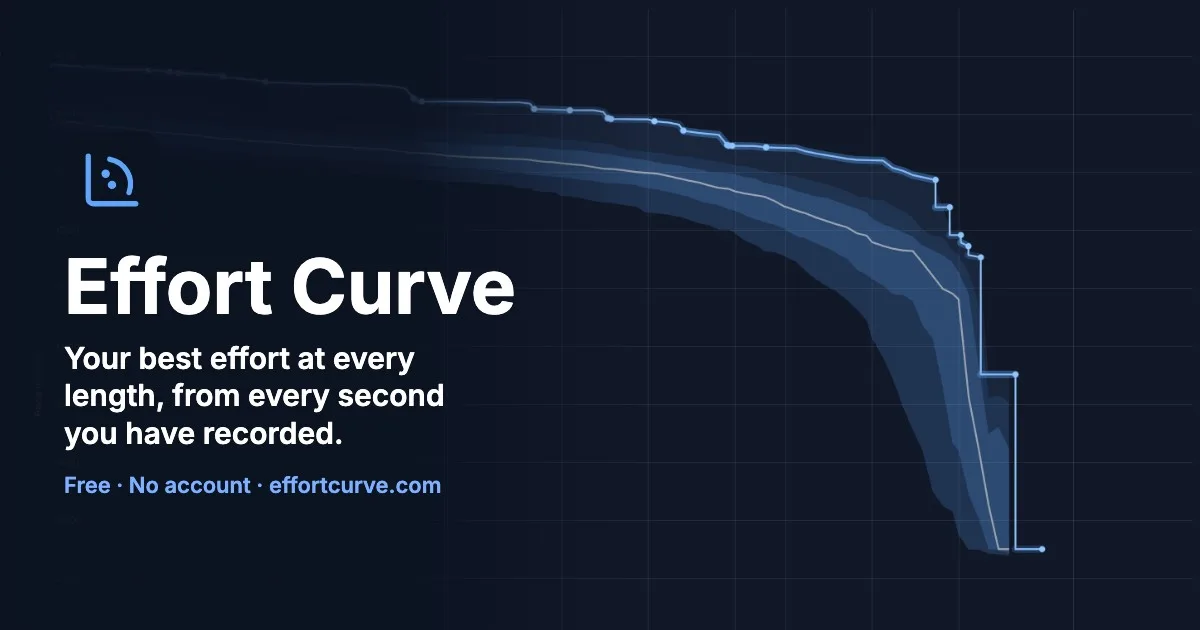
A cyclist's power curve shows the best power held for every duration. Effort Curve draws that picture for everything you record: the best power, pace, climbing rate or heart rate you have held over every duration or distance, in every sport.
What it does
- Bring your activities. Import a Strava or Garmin export, or loose FIT, GPX and TCX files. Or connect your own Garmin MCP or Strava MCP server and pull from it.
- See your curves. The best effort at every duration or distance, across all activities or one period, with filters and bands by gradient, heart rate, time into the activity and more. Animate the curve over time, or show the frontier: which efforts make up the curve.
- Drill down. Click a point to see the activity behind it, the window on a map, its streams, and how it compares with other activities.
Local-first
Your files stay in your browser. The library lives in the browser's origin-private file system, the numbers are computed in a worker, and nothing is sent to a server. There is no account.
The engine
The curves come from effort-cubes, a Rust engine I wrote for this and compiled to WebAssembly. It puts each activity on a 1 Hz grid of running totals and returns exact mean-max curves, filters, groups and frontiers. The same engine has Python bindings, and the app's numbers are checked against a reference notebook built on them.
The source is not public.